Visaphors: High-Definition Stereo Visualizations
Artists and scientists have a common goal – that of making the invisible visible. Many of the images resulting from collaborative scientific visualizations represent a convergence of art and science. These images are yielding some of the most beautiful, and meaningful, imagery of our time
Donna Cox is the Director of the Advanced Visualization Lab (AVL) at the National Center for Supercomputing Applications (NCSA). The NCSA AVL Lab works closely with computational scientists to employ advanced-technology graphics and novel digital displays, including large-format IMAX film, high-definition television productions, and museum digital domes, to visualize advanced largescale supercomputing simulations.

Colliding Galaxies
Donna Cox’s deepest passion is to bring scientific ideas to large, non-expert audiences through the development and aesthetic rendering of Visaphors. These compelling, data-driven computer graphics visualizations are inspiring to people and often have “legs” within society. Cox coined the term Visaphor to distinguish data-driven visualizations developed from quantitative data from visualizations that are metaphorically derived. They are models and metaphors used to speculate about invisible patterns and forms in the natural phenomenon by using computer-mediated and digital technologies to display quantitative and qualitative information. Visual variables used to represent quantitative data in the Visaphor greatly influence how we interpret and apply meaning to that data. For example, the initial “meaning” of a Visaphor can be overwhelmed by the captivating visual qualities of the image. However, displaying visuals in immersive environments, such as the VisBox(TM) – a display device for high resolution and immersive three-dimensional graphics applications – can intensify the sensual and information rich experience.

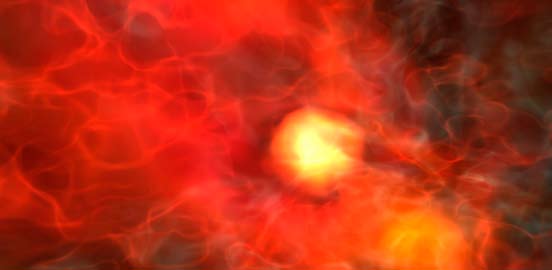
A Star is Born
In 1986, Donna Cox formulated the idea of collaborative Renaissance Teams of which the AVL is one that provides a creative research environment to support the realization of Visaphors. It is comprised of an interdisciplinary mix of visualization experts. Robert Patterson is a master choreographer, visualization artist, and musician/composer. Stuart Levy is a senior visualization programmer. Alex Betts has an MFA in graphic design and is a senior visualization programmer. Matthew Hall has a Masters in mathematics and is a visualization programmer. Lorne Leonard has a Masters in Architecture and is a visualization programmer. Visaphors created by the Advanced Visualization Lab, under the creative leadership of Donna Cox, have been viewed by thousands of people in planetariums, Public Broadcasting television programs, school books, science museums and other informal science education and outreach venues. They have had great impact on popular culture’s encounter and understanding of science.
Visualizing Evolution
High Definition Stereo Three-Dimensional Scientific Visualizations
Six sequences of three-dimensional scientific visualizations displayed in high-definition (1920 × 1080 pixel resolution) stereo using a VisBox™ display system are presented in the exhibition. The system will be driven by donated equipment from Apple including two Xserve RAID arrays with 14 terabytes of disk space. Participants experience the three-dimensional colorful animated Visaphors by wearing stereo glasses. The visualization and simulations viewed in the exhibition described below include phenomenon from F3 Tornados and ocean flow to the astrophysics of supernova and colliding galaxies.
In collaboration with the Monterey Bay Aquarium Research Institute (MBARI), AVL developed Visaphors of ocean flow and temperature. During the AOSN II field experiment, the first large-scale eployment of vehicles was used to predict the evolution of episodic wind-driven upwelling in the environs of Monterey Bay. The observing system included a communication framework that allowed observations to be transmitted to two real-time oceanographic models: HOPS and ROMS. The 3D Visaphors below are the first to reveal these ocean flows in stereo 3D graphics. AVL created each of the visualizations in collaboration with scientists.
- Ocean and Bay Visualization from a Grand field experiment in the Monterey Bay. Scientific simulation: Yi Chao, JPL/Caltech, Regional Ocean Modeling System (ROMS) model, for the AOSN II.
- Ocean and Bay Visualization from a Grand field experiment in the Monterey Bay. Scientific simulation: Allan Robinson, Pierre Lermusiaux, Wayne Leslie, Harvard University, developed and computed the Harvard Ocean Prediction System (HOPS), for the AOSN II
- Visualization of the Anatomy of a Deadly Tornado from the Storm Chaser Perspective. Scientific simulation: Robert Wilhelmson, Matthew Gilmore, UIUC; Lou Wicker, National Severe Storms Lab/NOAA.
- Visualization of the Evolution of the Universe from 20 million to 14 billion years old. Scientific simulation: Renyue Cen, Jeremiah P. Ostriker, Princeton University.
- A Star is Born, Lives, and Goes Supernova visualization. Scientific simulation: This simulation is an adaptive mesh refinement model developed by Michael Norman, UCSD; Brian O’Shea, LANL.
- The Formation of our Home Milky Way galaxy from 16 million to 13.7 billion years old. Scientific simulation: This simulation is an adaptive mesh refinement model developed by Brian O’Shea, LANL; Michael Norman, UCSD.
- The Explosive Ramifications from Galaxies Colliding and Merging. Scientific simulation: Brant Robertson, University of Chicago; Lars Hernquist, T.J. Cox, Harvard University; Volker Springel, Max-Planck; Tiziana Di Matteo, CMU.
- An Astrophysical Jet forming from a rotating Black Hole. Scientific simulation: John F. Hawley, University of Virginia; Julian H. Krolik, Johns Hopkins University.
- A Virtual Flight to the Center of our Milky Way galaxy. Scientific advisors: Mark Morris, UCLA; Doug Roberts, Northwestern/ Adler Planetarium, Chicago.
No comments yet. Why not add the first?
Acknowledgements & Credits
Credits
Texts: All texts were written by the exhibition participants.
Editor: Pamela Jennings, Pittsburgh, PA (USA)
This work has been republished from the 2007 Exhibition 'Speculative Data and the Creative Imaginary: Shared Innovative Visions between Art and Technology' curated by Pamela Jennings As part of the ACM Creativity and Cognition Conference at at the National Academy of Sciences' headquarters at 2100 C St., N.W., Washington, D.C. The original exhibition catalogue can be found at: http://www.pamelajennings.org/PDF/NAS_Catalog.pdf
Exhibition Sponsors
Office of Exhibitions and Cultural Programs of the National Academy of Sciences presenting a program of exhibitions that explore relationships among the arts and sciences, engineering and medicine.
http://www7.nationalacademies.org/arts/
The 2007 Association for Computing Machinery Creativity and Cognition Conference held in Washington D.C. June 13th – 15th, 2007, exploring the theme of cultivating and sustaining creativity: understanding how to design and evaluate computational support tools, digital media, and socio-technical environments that not only empower our creative processes and abilities, but that also encourage and nurture creative mindsets and lifestyles.
http://www.cs.umd.edu/hcil/CC2007/
National Science Foundation Computer, Information Science and Engineering (CISE) Creative IT Program, exploring the synergies between creativity and information technology, science, engineering, and design research.
Copyright is held by the author/owner(s) of the text and images reproduced in this catalog.
← Back to work
0 Comments