Aurora
Visualizing the evolution of ten years of new media discourse at the Banff New Media Institute
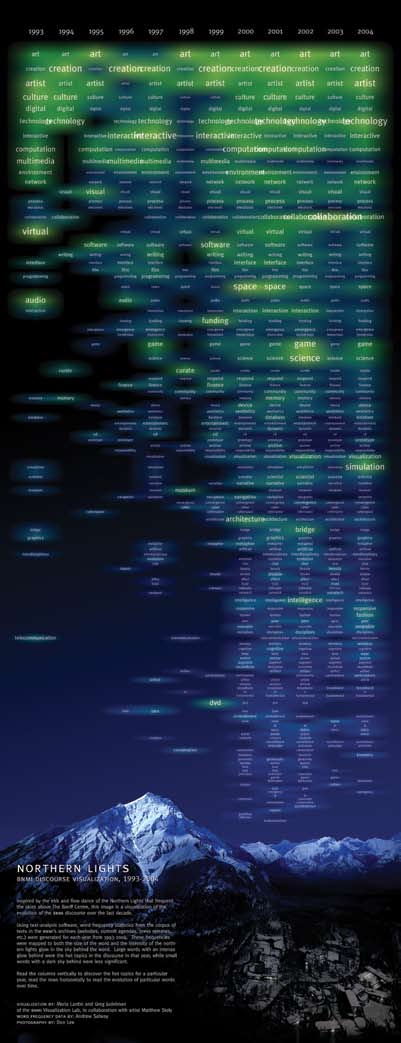
Aurora, printed visualization of text analysis of new media discourse over 10 years
Inspired by the ebb and flow dance of the Northern Lights that frequent the skies above the Banff Centre in Canada’s Rocky Mountains, this image is a visualization of the evolution of the Banff New Media Institute (BNMI) discourse over the last decade.
Word frequency statistics were generated using text analysis software that analyzed the corpus of texts in BNMI’s 1993-2004 archives (websites, summit agendas, press releases, etc.). These frequencies were mapped both to word size and glow intensity. Large words with a bright glow behind were important topics in the discourse in that year, while small words with a dark sky behind were less significant. Read the columns vertically to discover the popular topics for a particular year, read the rows horizontally to discover the evolution of particular topics over time. This visualization was designed in collaboration with Matthew Sloly, word frequency data by Andrew Salway (University of Surrey), and photography by Don Lee.
No comments yet. Why not add the first?
Acknowledgements & Credits
Inspired by the ebb and flow dance of the Northern Lights that frequent the skies above the Banff Centre in Canada’s Rocky Mountains, this image is a visualization of the evolution of the Banff New Media Institute (BNMI) discourse over the last decade.
Word frequency statistics were generated using text analysis software that analyzed the corpus of texts in BNMI’s 1993-2004 archives (websites, summit agendas, press releases, etc.). These frequencies were mapped both to word size and glow intensity. Large words with a bright glow behind were important topics in the discourse in that year, while small words with a dark sky behind were less significant. Read the columns vertically to discover the popular topics for a particular year, read the rows horizontally to discover the evolution of particular topics over time. This visualization was designed in collaboration with Matthew Sloly, word frequency data by Andrew Salway (University of Surrey), and photography by Don Lee.
← Back to work
0 Comments